
Explainable artificial intelligence, or XAI, aims to make the way a system reaches its results understandable. For a business, an explanation should help a person check a recommendation, find an error or decide which information requires further analysis. It is a requirement spanning different types of AI, from statistical models to complex recommendation systems.
The explanation must suit the person using it
A support operator needs to understand why a case was prioritised. A technical administrator may need variables, versions and calculations to investigate the model. The same result may require two presentations of the same evidence. The interface should preserve the connection between the accessible explanation and its underlying technical information.
NIST describes four principles: providing an explanation, making it meaningful to the recipient, ensuring fidelity to the mechanism and respecting the system's knowledge limits. For a business owner, these can become testable project requirements: what is displayed, to whom, from which data and what happens when an input exceeds the application's evaluated domain.

A priority score explained step by step
Consider a demonstrative calculation for prioritising support requests. The baseline score b is 0.30. In this example, x1 represents an unavailable service and adds 0.20, x2 represents an approaching deadline and adds 0.15, while x3 indicates an available workaround and subtracts 0.05. The resulting sum is 0.60.
How the priority score is composed
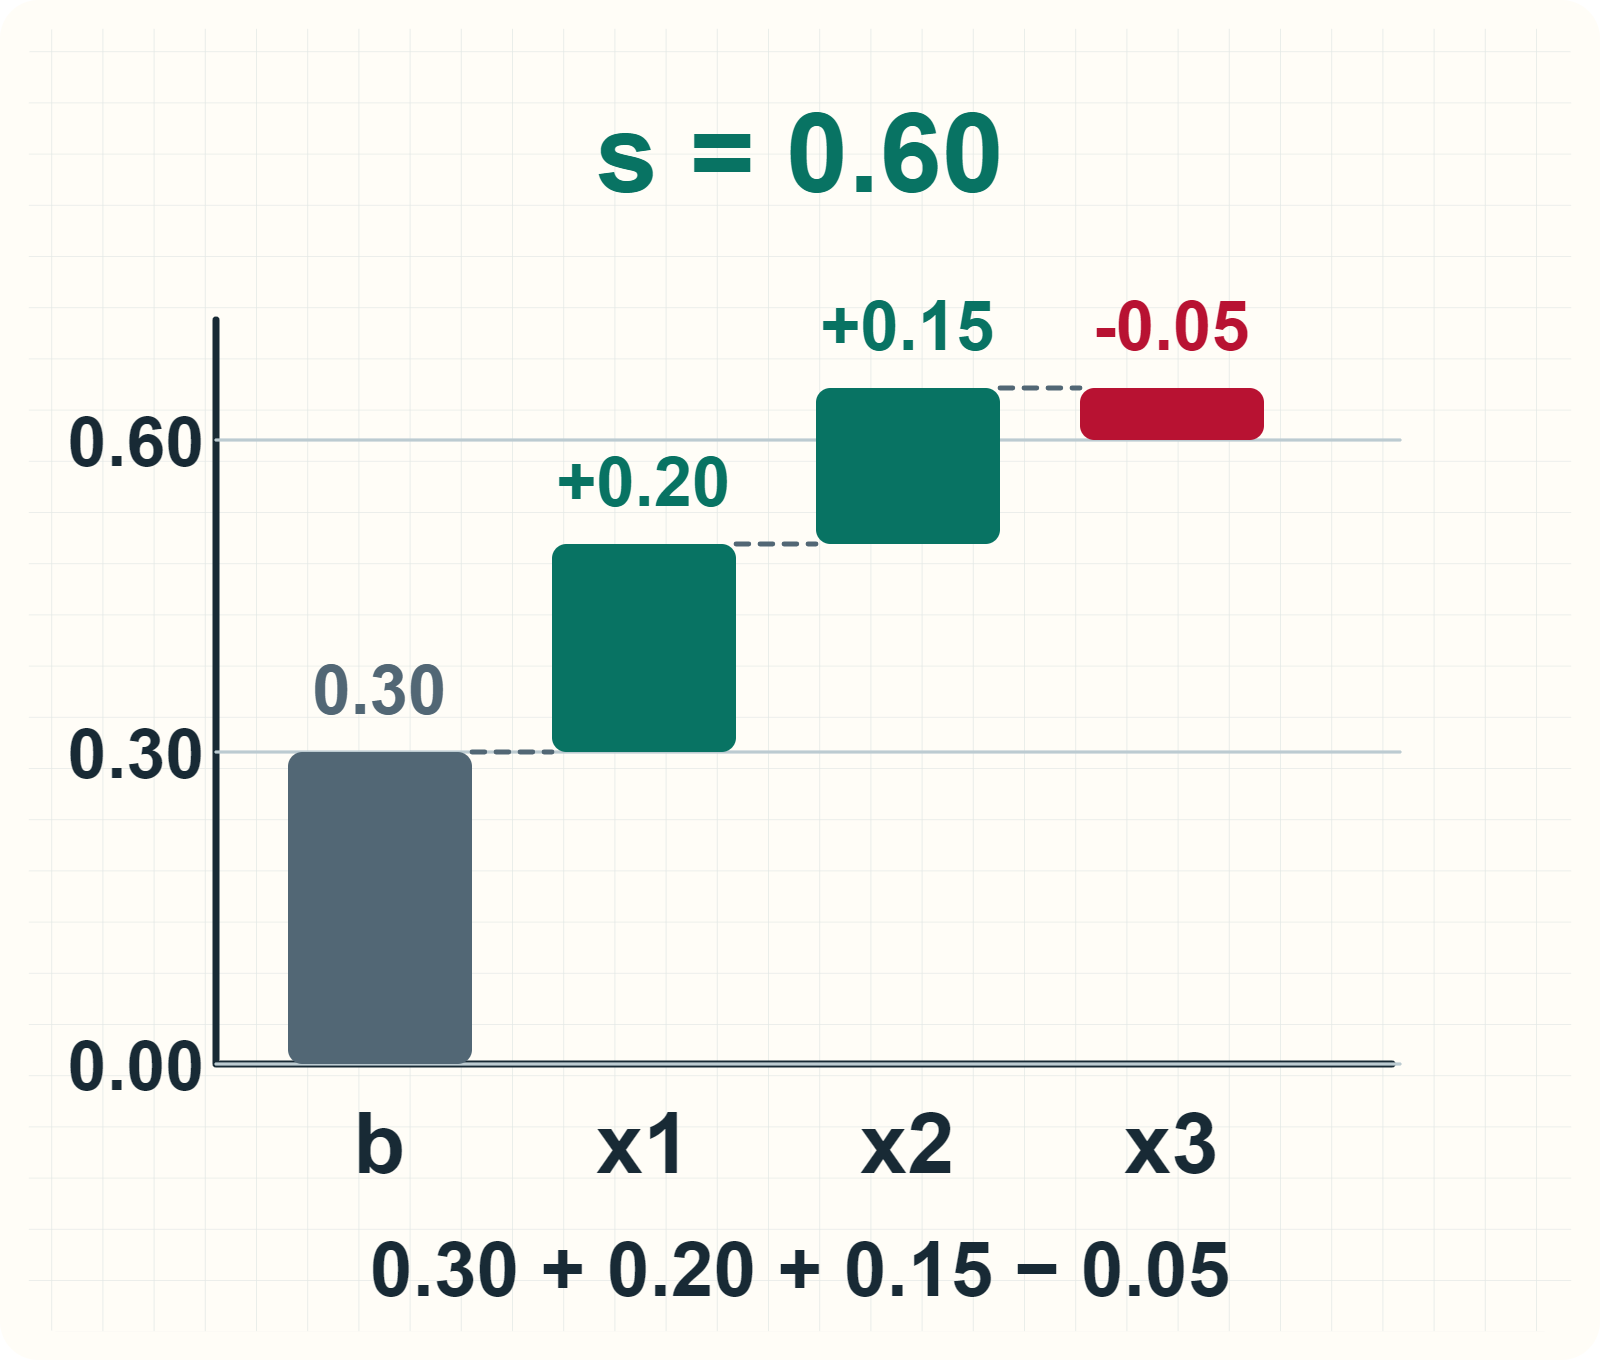
The values are chosen for explanation and expressed in arbitrary score units. A result of 0.60 does not mean a 60% probability. The drawing shows how an additive score is composed; in a real model, the output unit, contribution calculation and any transformations must be stated and checked.
A useful interface can display contributions alongside the request data. The operator can then see that “approaching deadline” was calculated from an incorrect date and correct the input. After recalculation, retain both the information change and model version. The explanation becomes a working tool linked to a precise action.
Local explanation and the overall picture
A local explanation concerns a particular result: why does this request have this score? A global explanation describes model behaviour across a set of cases or how features are generally used. A variable important overall may have a small contribution in a particular case, depending on its values and the model.
| Presentation | Question | What to retain |
|---|---|---|
| Local | Why this result? | The case, model and corresponding contributions |
| Global | How does the model behave overall? | Analysed dataset, period and method |
| Operational | What can the person check? | Accessible data and permitted actions |
A model with an interpretable structure can expose components of its calculation directly. Additive models, for example, can separate feature contributions, and some include interactions that must also be explained. Other models use post-hoc explanation methods. Select the approach according to the question being checked and the available access to the system.
Connecting the result with evidence
- Data and version
Identify used inputs, evaluation time and model version. Retain relevant units and transformations.
- Mechanism
Show the calculation or explanation method and its reference. Check that the presentation reflects the analysed system.
- Role-specific interface
The operator sees checkable elements; the specialist can inspect details needed for investigation.
What SHAP does and what a report must specify
SHAP, short for SHapley Additive exPlanations, is an explanation method that assigns feature contributions to a model’s prediction. Its explanation depends on the analysed model, the method used and the reference chosen for comparison. The report should identify which output is being explained and the units in which contributions are expressed. For a classifier, an internal score and a displayed probability can have different representations.
A contribution to a prediction is not automatically the effect of an intervention on the business. If history shows that certain requests receive later responses, an explanation may reflect that learned association. Establishing the effect of a process change requires a causal analysis or suitable experiment. A contribution diagram does not replace that design.
Checking an explanation's fidelity
Prediction accuracy and explanation accuracy are evaluated separately. A result may be appropriate while its displayed explanation fails to reflect the calculation used. For the demonstrative score, checking is straightforward: the baseline plus contributions must match the output. For approximate methods, the technical team establishes the tests and domain in which the explanation represents model behaviour sufficiently well.
Also test the presentation with the people who will actually use the application. Ask them to identify the information influencing the result and the required verification step. An explanation overloaded with technical terms can be faithful but unsuitable for the role. A simplified description must preserve the calculations' meaning, including the distinction between a missing value and a small value.
For each result, bind its explanation to that evaluation’s identifier and model version. In acceptance requirements, check whether an operator can locate an incorrect value, submit it for correction and compare the recalculated result with the original. Test understanding through these actions, rather than only through the impression that the wording is easy to read.
Three questions when reviewing an explanation
- Is it faithful?
Displayed contributions and reasons originate from the evaluated mechanism. For the additive example, check the sum against the score.
- Is it understandable?
The person identifies relevant data and the verification action. Test the presentation with users in that role.
- Which question does it answer?
Separate prediction explanation from intervention effects. A predictive reason does not automatically become causal advice.
Why chatbot text is not evidence of the calculation
A language model can write an accessible explanation from the data and contributions supplied to it. For audit purposes, however, the application retains the analysed mechanism's result and the inputs actually used. If the language model invents a plausible reason absent from the calculation, that text must be corrected or rejected within the review flow.
WebHat can design explanation displays, history and review permissions within custom applications with AI integration. An appropriate starting point is an operational recommendation with data accessible to the team, such as support-request ordering. The project establishes who can correct data, who approves rule changes and how to track the difference between the original recommendation and the applied decision.
Questions about explainable AI
Is explainable AI a separate model type?
Explainability is a property pursued in different systems. It can be supported by model structure, additional methods and the application's interface.
Does a clear explanation show that a result is correct?
Clarity supports understanding. Result accuracy is checked on evaluated cases, while explanation fidelity is checked against the mechanism used.
Can we change a variable to obtain the indicated effect?
A predictive contribution describes the model. The effect of a real-world change requires analysing the causal mechanism and proposed intervention conditions.
What should we retain for a later review?
The input data used, analysis time, model version, explanation method, reference and result. The history should allow the case and applied decision to be reconstructed.