
Causal AI uses models of cause-and-effect relationships to answer questions about interventions: what changes if a business modifies an action? Prediction estimates an outcome under observed conditions; causal analysis investigates the effect of changing a condition. For business owners, the distinction matters when choosing a promotion, evaluating a sales-flow modification or comparing two interventions in the same process.
Higher sales during a promotion: which question are we analysing?
A shop may observe that promotional weeks have higher sales. This association is useful for describing the data, but the commercial question is more precise: how many additional sales does the promotion produce compared with the situation in which it was not applied? For the same period, the shop observes only the outcome of the action actually chosen.
In a demonstrative example, seasonality influences both the decision to run the promotion and demand. A campaign may be scheduled before a holiday precisely because interest is already higher. Attributing the entire difference to the promotion mixes the effect of interest with this common cause. Analysis starts by describing the process, rather than selecting the algorithm with the best prediction.
Seasonality is a confounder here: it influences both whether the promotion runs and sales. Identifying such factors separates “what happens together?” from “what does the intervention change?”. Explaining a prediction shows how the model calculated an outcome; causal analysis investigates an action’s effect on the real process.

What a causal graph shows
The drawing uses S for seasonality, P for the promotion and Y for sales. Arrows from S to P and S to Y represent the assumption that the season influences both variables. The arrow from P to Y represents the relationship whose effect we want to estimate. This is a demonstrative process model, not a result obtained from client data.
Two paths between promotion and sales
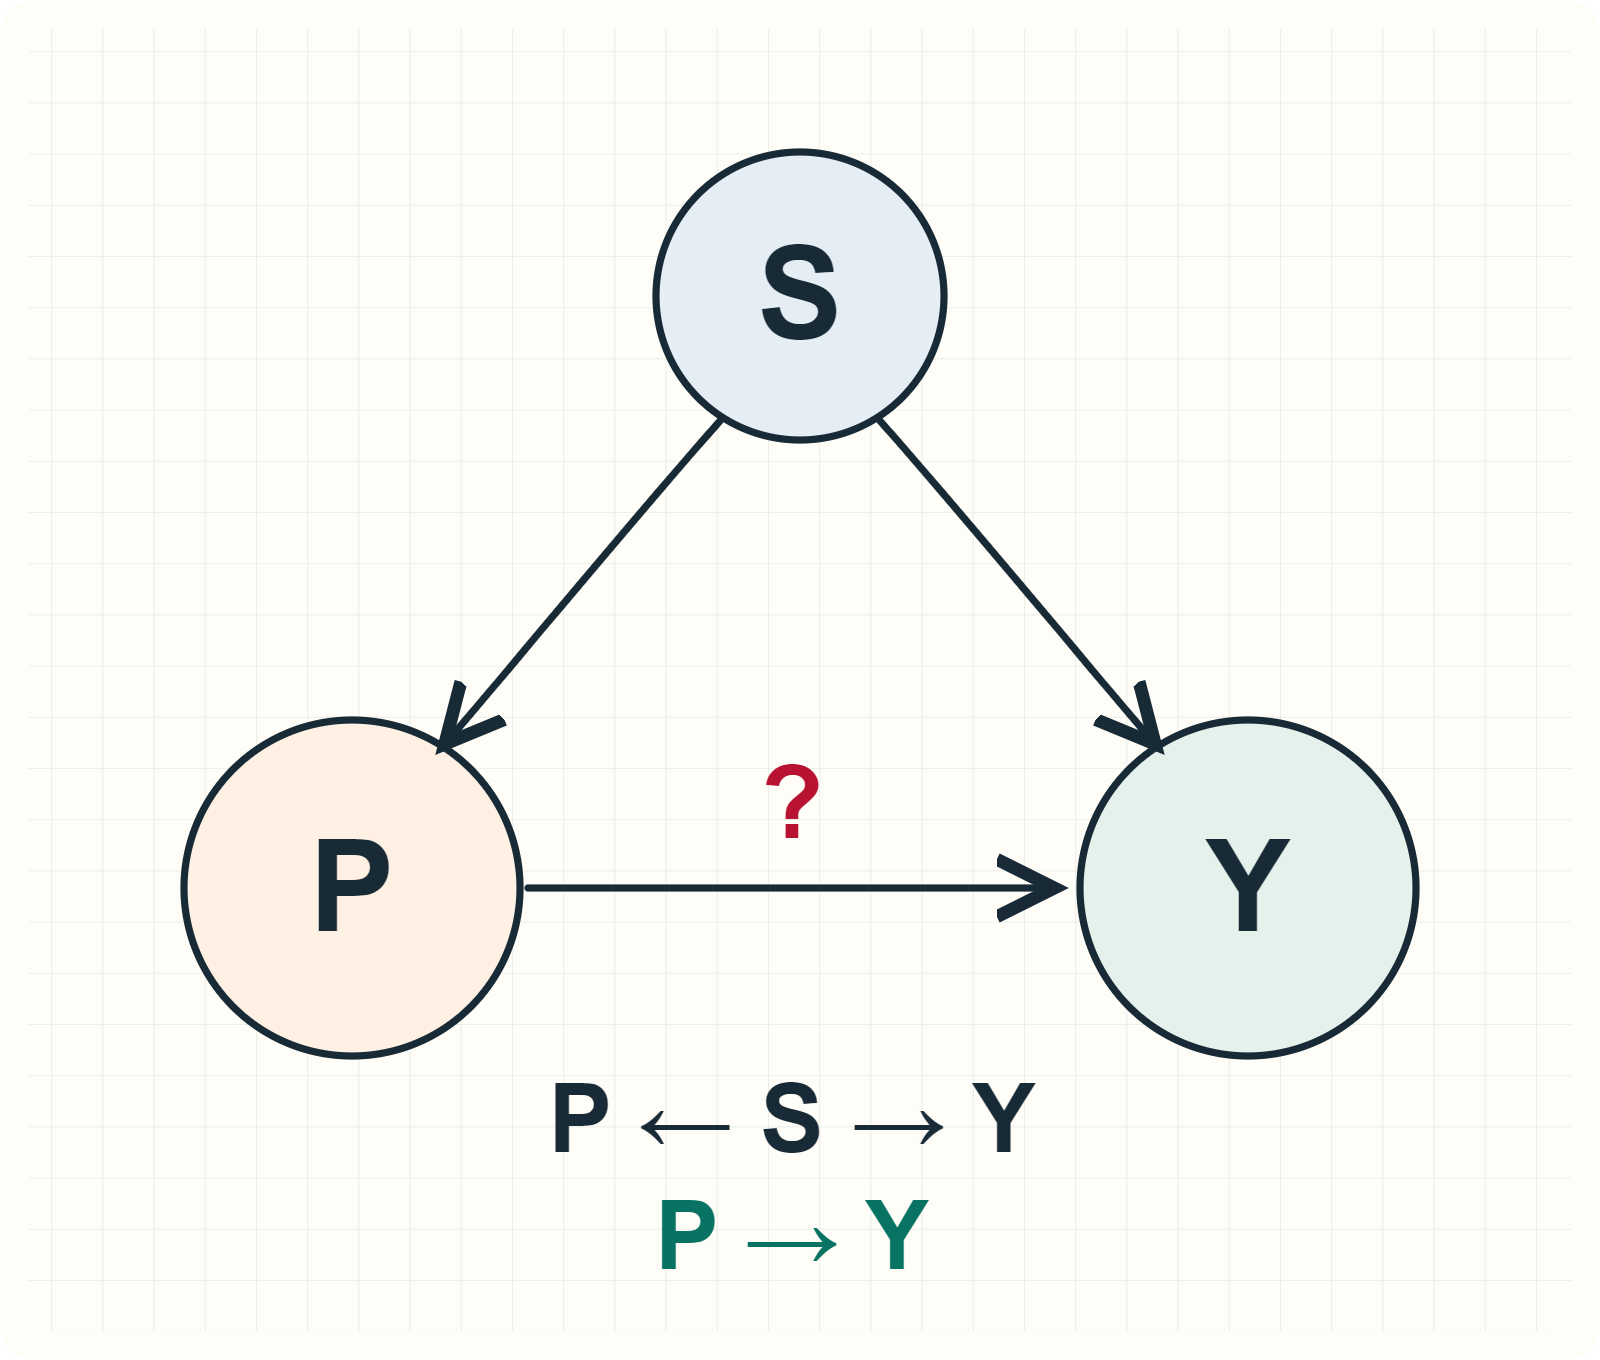
A graph should be discussed with people who understand the operation. A real project establishes the variable being changed, the measured outcome, the evaluation period and the relevant common causes. It may also matter that a discount was sent only to customers at risk of leaving. Their history influences both receipt of the offer and the probability of ordering.
The choice of adjustment variables depends on the proposed causal structure. Adding every available column to a regression does not automatically solve the problem: some variables may be consequences of the promotion or introduce other distortions. DoWhy's documentation separates two stages: identification uses causal assumptions to establish whether and how the effect can be calculated from data; estimation applies the selected method and produces a numerical value.
Three questions requiring different analyses
A predictive question might be “what sales do we forecast for tomorrow under the known conditions?”. An intervention question is “how would sales change if we applied a defined promotion?”. A counterfactual question concerns a situation that has already occurred: “what outcome would that situation have had if the action had been different?”. The last question requires a model and assumptions about the mechanism of the case being analysed.
Choose the question before the method
- Prediction
Estimate the outcome for conditions described by the inputs, using data available at analysis time.
- Intervention
Estimate how the outcome changes when a defined action is applied to an established population and period.
- Counterfactual
Analyse an already observed situation under an alternative action, using a mechanism model and its assumptions.
These questions are not resolved by rewording a prompt. A language model can help organise an analysis plan or explain a report, but the effect must be calculated using a method appropriate to the data and study design. The text describing the analysis must preserve the distinction between an observed association and an effect estimated through that design.
A simplified experiment and the effect calculation
Suppose a demonstrative experiment has two groups of 1,000 eligible visitors, randomly assigned during the same period. The control group sees the ordinary offer, while the test group sees the defined promotion. We use the same conversion window and count visitors who placed an order, once per person.
| Group | Visitors / buyers | Conversion |
|---|---|---|
| Control | 1,000 / 100 | 10% |
| Promotion | 1,000 / 120 | 12% |
| Difference | 20 buyers with equally sized groups | 2 percentage points |
The difference between 12% and 10% is two percentage points, equivalent to a relative increase of 20%. This calculation does not replace statistical evaluation. The experiment report must include the estimated effect’s uncertainty interval, the number of visitors analysed and a check that random assignment to groups was implemented correctly. The visitor count in the example illustrates arithmetic; the size of a real test is established from the effect of interest and required precision.
What to prepare when using historical data
When experiments are unavailable, observational analysis requires explicit assumptions about group selection and factors influencing the outcome. Check action timestamps, the history available before intervention and shared metric definitions. Two exports with the same column name can use different attribution windows or filters.
Sensitivity and robustness checks examine how the estimate changes when assumptions or selected analytical choices change. If the result changes substantially, the report should explain why and what additional information is needed. The operational finding specifies the intervention, group analysed, period and assumptions supporting the estimate.
A promotion evaluation brief
- Action and population
Describe the offer, eligible people, period and group-assignment method. Keep treatment consistent.
- Outcome and measurement
Define a buyer, conversion window and tracked commercial metrics. Check events before the test.
- Analysis and decision
Report the difference, estimation precision and design checks. Connect interpretation to the action established in advance.
From analysis to the business owner's decision
Choose a metric corresponding to the decision. A promotion may change conversion and, simultaneously, order value, margin or returns. Measure these outcomes separately for the same intervention and period. Before the test, the team establishes which decision it will make and which metrics to track, without retrospectively selecting only the favourable result.
WebHat can prepare data collection and integration, experiment interfaces and result presentation within custom applications with AI features. The analytical method and experimental design are established with the person responsible for evaluation. A well-bounded first project can compare two workflow variants, with consistently measured events and a clear action following analysis.
Questions about causal AI
Does an accurate prediction demonstrate causation?
Accuracy describes how well an outcome is estimated on the evaluated data. An intervention's effect requires a causal design and the corresponding assumptions.
Is a before-and-after test sufficient?
The comparison must also address simultaneous changes: season, traffic, prices or other campaigns. The design establishes how these influences are separated.
Does causal AI necessarily mean deep learning?
No. Causal analysis can use experiments, statistical models, graphs and different estimation methods. The choice starts with the project's question and data.
Which document should we prepare first?
A brief identifying the intervention, target group, outcome, period, assignment mechanism and possible common causes. It guides data collection and analysis.