
LinkedIn is beginning a global rollout of a table that brings a member's post performance metrics into a single view. The announcement published on 3 November says the new Post Performance Table is rolling out gradually on desktop this week, with mobile support to follow. The table allows posts to be compared and individual analytics to be opened without working through each item on a profile in succession.
The update expands content analysis for members and creators. It adds to the Dashboard presented in October, which brings together tools for managing a presence on the platform. November's development is the tabular view of posts and their results, alongside explanations of the available metrics and how the data should be interpreted.
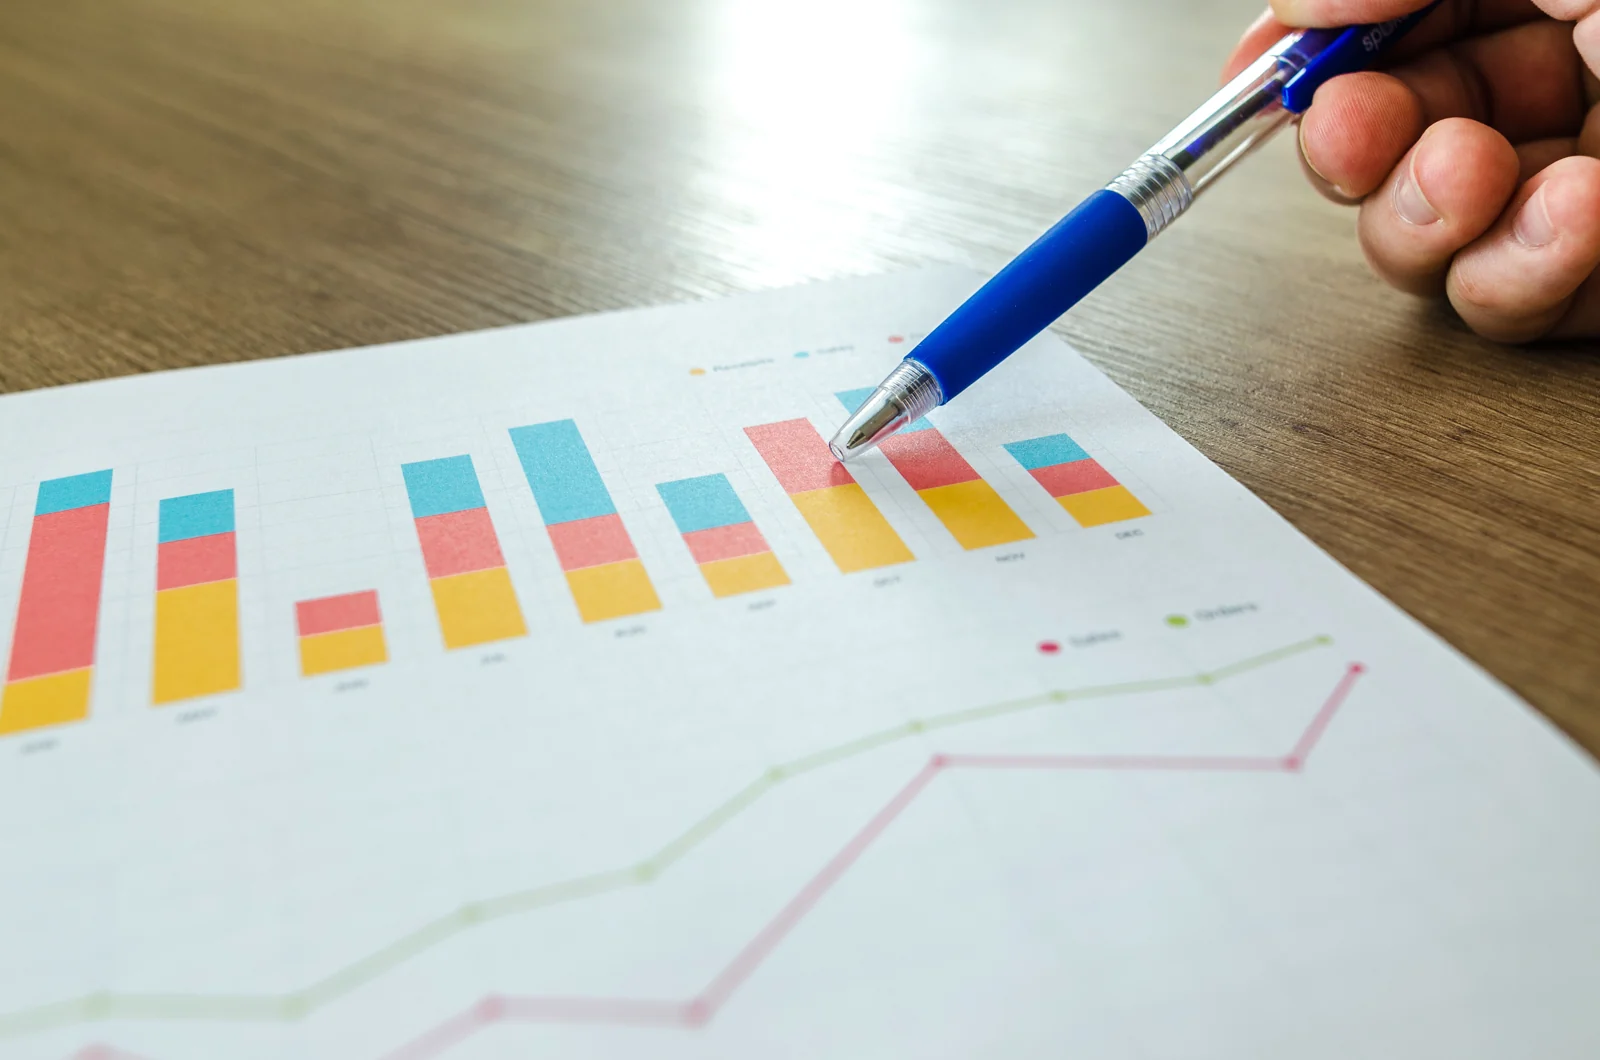
Recent posts can be compared in the same table
According to LinkedIn, the new view includes impressions, members reached, video views, watch time, followers gained, reactions, comments, reposts, sends and saves. The availability of a metric depends on the post format. A post without video is not assessed through the same fields as a clip, and a dash in the table indicates a metric that is not applicable or available.
The full list shows the most recently created posts first. Selecting a post opens its individual analytics. Collaborative posts can also appear when the member is the original poster or an accepted collaborator; these are identified separately with a collaboration label. The organisation maintains the connection between the overall comparison and the information for each item.
Distribution is gradual. The announcement describes a global desktop rollout, rather than simultaneous activation for every account and device. LinkedIn's documentation explicitly retains that access stage and identifies mobile support as a later step. The capabilities presented concern member analytics, distinct from the analytics tools for company Pages.
The date range selects posts, while their metrics remain cumulative
One particular feature of the new table concerns its date filter. The chosen range determines which posts appear, based on when they were created. The metrics on each row, however, are the lifetime totals accumulated by that post. Changing the range does not turn those numbers into results achieved exclusively between the two selected dates.
This rule differs from the overall content performance graph, which tracks impressions or engagements within the period being analysed. For that graph, LinkedIn uses completed days and displays data up to the previous day. A list of posts published in a particular week and the account's overall performance during the same week therefore describe two different perspectives on activity.
Combined analytics supports a date range from seven to 365 days and export to an XLSX file. Exporting allows data to be retained and examined outside the interface, while selecting an item in the table continues to open its detailed analytics. The cumulative row values retain the same meaning as the totals in the post's individual analysis.
For overall trends, the interface also offers a choice between daily and cumulative views. The first shows performance on each day in the range, while the second follows the accumulation of results over the period. That selector organises the trend graph and is distinct from filtering posts by publication date in the new table. In both cases, the period's meaning depends on the view being consulted.
Three perspectives on a post
- ImpressionsHow many times the content appeared on screen.
- Distinct reachMembers and Pages, excluding repeated views.
- EngagementsReactions, comments, reposts, saves and sends.
Impressions, distinct reach and engagements measure different things
LinkedIn defines impressions as the number of times a post appears on screen, specifying that the metric is a platform estimate. The same member can generate more than one impression. Members reached counts the distinct members and Pages that saw the content, without counting repeated views by the same entity. The two numbers are consequently not interchangeable.
The division between the author's network and audiences outside it is expressed as percentages of impressions. The in-network category includes members who follow or are connected to the author; the other category covers those who neither follow nor are connected. Those percentages describe the distribution of impressions, rather than a division of the number of unique people who saw the post.
Engagements combine reactions, comments, reposts, saves and sends. Saving records content being kept for later reference, while sending concerns sharing it with others within LinkedIn. Reposting to the feed is a separate action. Total engagements also account for removals, such as a member withdrawing a reaction or deleting a comment.
These differences matter to social media content performance analysis: an impression describes exposure, a member reached describes distinct audience reach, and a save or send describes an action on the content. The table brings them into one view while retaining each metric's definition and the characteristics of the published format.
More detail on video and followers gained
For video posts, a view is recorded after at least two continuous seconds of playback, and replays can count towards the total. Total watch time adds up the duration watched, while average watch time divides that duration by the number of views. These figures distinguish playback and continued watching from a post simply appearing in the feed.
The update also describes the ability to see the profiles of members who started following the author from a post. The information concerns that specific follow action, rather than turning analytics into a named list of everyone who saw the content. Post analytics are private to the member consulting them, and demographic details have audience thresholds intended to protect privacy.
LinkedIn notes that the author's own views and engagements can be included in the metrics. In the new organisation, the comparison table, trend graphs and individual analytics remain complementary levels: they show the selection of posts, performance over time and the results of each item, with distinct calculation rules and reference periods.